The Problem
The Challenge
An e-commerce fashion store was running Google and Meta Ads with no clear understanding of where their traffic was dropping off or which channel actually drove revenue. They were optimising campaigns blind - cutting budgets based on gut feeling, not data.
Key Insight
"GA4 funnel analysis revealed 68% of mobile users dropped off at the size chart step - one UX fix eliminated that drop-off entirely."
How We Solved It
Strategy & Execution
Set up GA4 properly (event tracking, conversion goals, e-commerce tracking), built a custom Looker Studio dashboard, and ran a 30-day analysis. Key analysis areas: traffic source performance, checkout funnel drop-off, product page behaviour, and mobile vs desktop conversion gap.
01
Audited the existing GA4 setup - found missing purchase event tracking and incorrect channel groupings causing data to be misattributed.
02
Rebuilt the GA4 event structure: ViewItem, AddToCart, BeginCheckout, Purchase - plus custom events for Size Chart Click and WhatsApp Click.
03
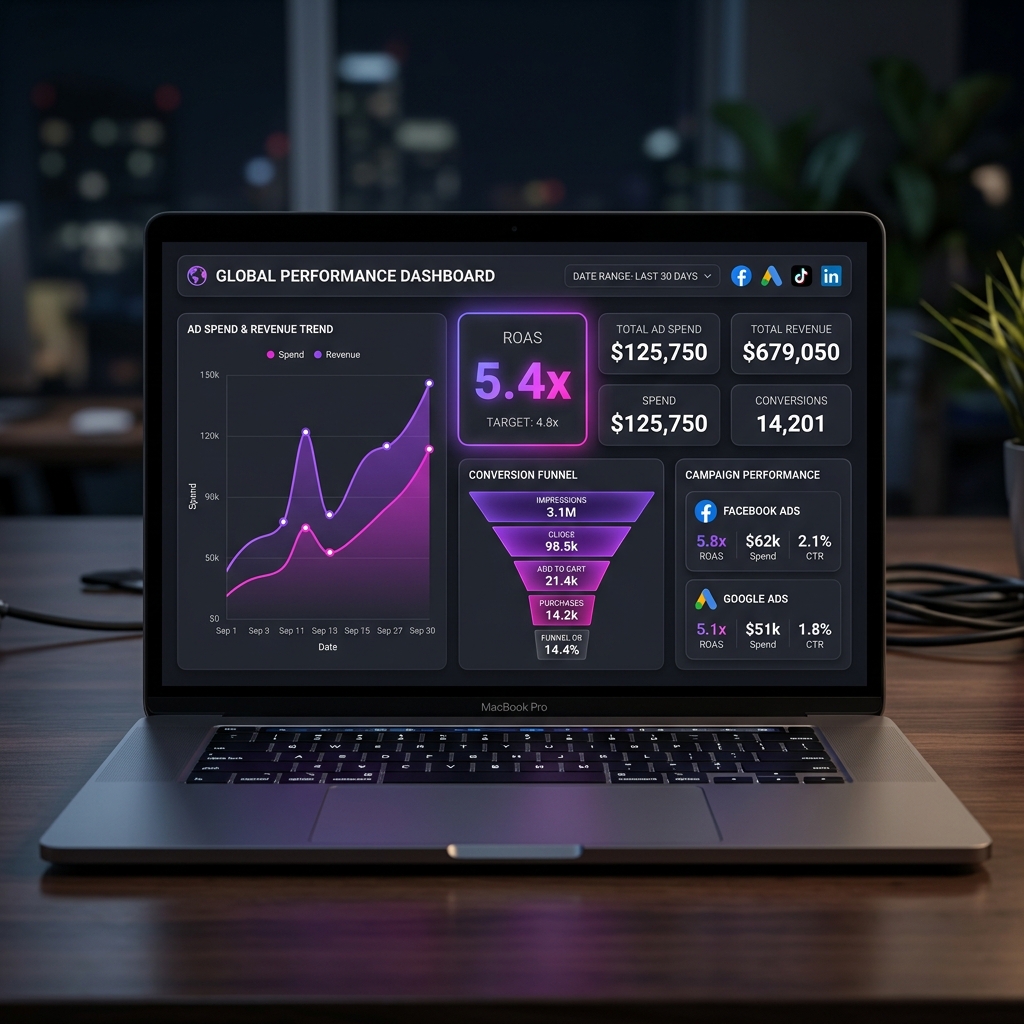
Built a Looker Studio dashboard with 6 key views: Traffic Overview, Channel Revenue Attribution, Checkout Funnel, Product Performance, Device Split, and Weekly Trend.
04
Presented 5 prioritised insights to the client with specific action recommendations - not just observations.
Want results like this?
Let's talk. I'll audit your current setup and show you exactly what's possible for your business.
Book a Free Strategy Call