The Problem
The Challenge
Built as a personal project to deepen expertise in fl_chart and local data persistence - and to have a strong, visually impressive Flutter portfolio piece that demonstrates data visualisation skills, which most Flutter devs lack.
Key Insight
"Using fl_chart's LineChart with gradient fill and animated data points made a simple expense graph look genuinely premium."
How We Solved It
Strategy & Execution
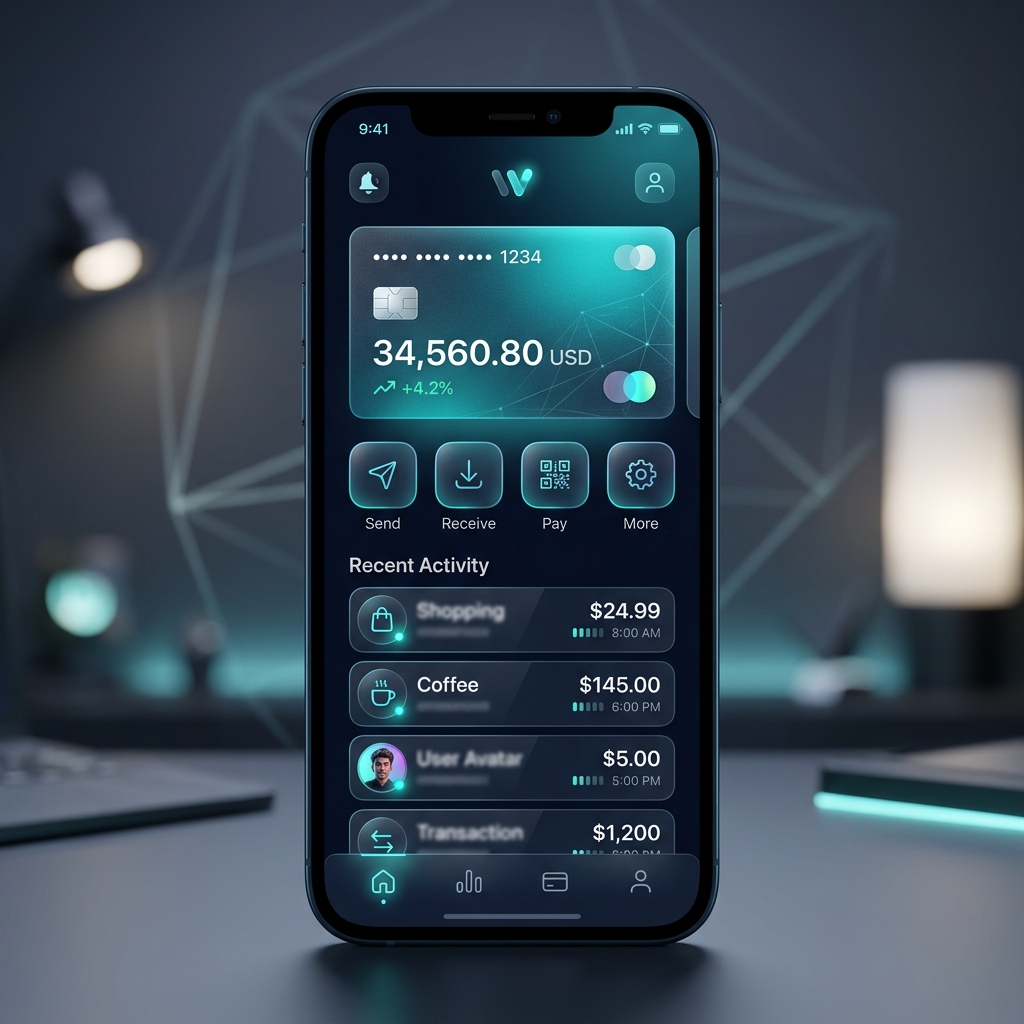
App features: transaction entry (amount, category, date, note), monthly overview with animated bar chart (spending per day), category breakdown pie chart, 3-month spending trend line chart, and budget limit alerts. Data stored locally with SQLite (sqflite package). Clean, modern UI with dark mode support.
01
Designed the data schema: Transactions table with category, amount, date, and note fields - normalised for efficient chart aggregation queries.
02
Implemented fl_chart BarChart for daily spending, PieChart for category breakdown, and LineChart for 3-month trend.
03
Added custom chart tooltips, animated data point transitions on screen load, and gradient fills for visual depth.
04
Built a budget system: user sets a monthly limit per category, app shows a progress bar and sends a local notification at 80% utilised.
Want results like this?
Let's talk. I'll audit your current setup and show you exactly what's possible for your business.
Book a Free Strategy Call